Inviting Fans to Recreate an Artist Logo as GPS Art in Paris
A collaboration with Ninho, Warner Music France, and Mapbox

This past week Warner Music France and I launched a mobile web app for french artist Ninho in support of his new record Destin. The app provided fans in Paris with step by step directions to recreate his “NI” logo as a GPS drawing. Those who took the journey received concert tickets and a gold record (symbolizing Ninho’s own gold certification for Destin.)
The kind folks at Mapbox actually made the introduction to Warner Music France happen due to our ongoing working relationship and my past music work with their technology for Greta Van Fleet, Guns N Roses, and Lord Huron. Be sure to check out Lo Bénichou’s excellent overview of this campaign’s user experience.

When I originally received this brief, my first thought was, “Oh, no. How are we going to create a ’N’ shape using streets?” (This is the kind of stuff I worry about) As it turns out, the street system in Paris is a bit more forgiving than the US grid I was accustomed to. (Even though I live in New Orleans, which is sorta the closest you’ll get to France in the US.) My next concern was making sure the client curbed their user experience expectations and agree on a simplified solution. Given the fact that this would be a real-world experience on various mobile devices and unknown cellular coverage, I wanted to make sure the core problem was solved and easily tested. I also wanted to keep the total footprint of the experience as minified as possible for quick loading. Sorry gang, no custom fonts on this one. Luckily, I didn’t receive any push back and in fact found that Warner was a dream client: Understanding, Inventive, and Responsive.
The web app was developed using Vue.js on my current framework of choice: Nuxt.js. I just love the way Nuxt handles so much of the core functionality of the app from routing to state management. I also brought in the excellent cookie-universal plugin to keep track of a user’s drawing progress just in case their signal cut out or the app refreshed for some reason. In order to keep track of the user’s location, I once again leaned on the browser’s own Geolocation API (and the user’s permission.) We did not store their location and instead used it as a pass-through variable alongside Turf.js functions to calculate proximity to stops and unlock progress. All of this was visualized using Mapbox GL and its excellent style specification.

The main driving data of the app is an array of JSON objects which contain the stop coordinates, coordinates required to draw a visually pleasing line between stops, the stop’s current state, and the custom text directions the user would see as they progressed through the experience. Here’s an example of one of these:
{
  coordinates: [
    2.342188,
    48.86357
  ],
  line: [
    [
      2.340831,
      48.860917
    ], [
      2.342188,
      48.86357
    ]
  ],
  status: 'locked',
  direction: "Ton destin est entre tes mains, bonne chance!"
}
As the user progresses through our experience, the status of each of these stops changes from locked to next to unlocked. From here it just takes a bit of work with Mapbox GL and its style capabilities to create a mapped visual.
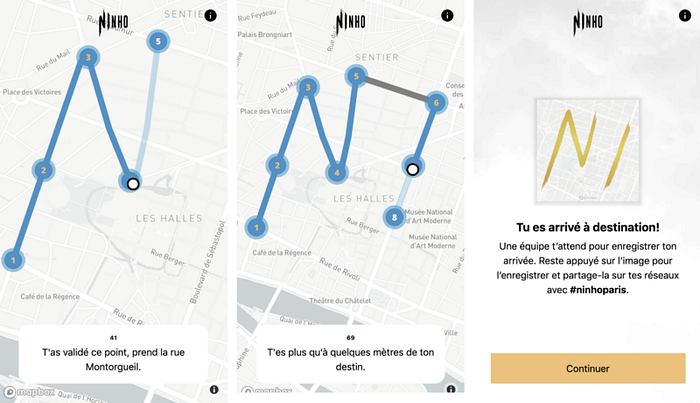
For example, the stops are represented by blue circles with a slightly transparent blue border. On top of these, is a number representing the stop’s position which is colored depending on the stop’s state. First, we add a new GeoJSON source to our map, mapping the stop coordinates as a collection of GeoJSON features. The properties we pass to these Features (index and status) will be used to style them dynamically.
map.addSource('stops', {
  type: 'geojson',
  data: {
    type: "FeatureCollection",
    features: this.stops.map((stop, i) => {
      return {
        type: "Feature",
        geometry: {
          type: "Point",
          coordinates: stop.coordinates
        },
        properties: {
          index: i + 1,
          status: stop.status
        }
      }
    })
  }
})
We can then add a layer of circles for each of these stops.
map.addLayer({
  id: 'stop-circles',
  type: 'circle',
  source: 'stops',
  paint: {
    "circle-radius": 15,
    "circle-color": '#0292CE',
    "circle-stroke-color": "rgba(2,146,206,0.5)",
    "circle-stroke-width": 5
  }
})
And then we can add the numbers on top of these circles. First, note how the previously declared “index” property is being used as the text field itself. We then use the match decision expression to adjust the text color depending on the status property. We’re just scratching the surface of what’s possible with Mapbox GL JS expressions.
map.addLayer({
  id: 'stop-numbers',
  type: 'symbol',
  source: 'stops',
  layout: {
    "text-field": "{index}",
    "text-font": ["Open Sans ExtraBold", "Arial Unicode MS Bold"],
    "text-size": 14
  },
  paint: {
    "text-color": [
      "match",
      ["get", "status"],
      'locked', '#000000',
      'next', '#FFFFFF',
      'unlocked', '#FABF63',
      'gray'
    ]
  }
})
Finally, as the user makes it to each stop, we update the stop status within the GeoJSON collection of Features to reflect stop changes. In order for the map to show this change, we simply need to reset the data for our stops map source.
this.map.getSource('stops').setData(stopsGeoJSON)
The outcome of this campaign was a bunch of happy fans walking (and scooting) together through the streets of Paris in support of Ninho. At the end of their journey, they were provided both digital and physical prizing. Thanks to all the fans who participated. Ninho Destin is out now.