Which Song Off SG Lewis’ Debut Album times Suits Me Best?
Using Spotify Listening History

Releasing a disco inspired record in the midst of a pandemic is probably not what SG Lewis had in mind for his debut, Times, but here we are. The album is filled with dance ready bangers accompanied by the likes of Nile Rodgers himself. For now, we’ll need to do our dancing from the comfort of our homes and wait patiently for this one to appear in clubs later on. 🕺
I was asked to create a simple personalized entry point so fans could identify with with the record. To do this, we decided to build a web app which can tell you which song off Times you may dig the most based on your Spotify listening history. Find out which song off the new record was made for you and read on to learn how the app was developed.
How Close Am I To A Song?
To figure out which song is closest to a particular user’s taste we used a mix of their Spotify listening history and track audio features to literally calculate a distance between the user and each track. First, we needed to manually define audio feature measurements for each song on the album.
Audio Features

As I have mentioned in previous case studies, Spotify provides an array of audio features for every track on their platform. Calculating interesting measurements, such as danceability, valence, and tempo. To kick off this project, I sent the client a spreadsheet with the following chart and he manually decided how each song off the new album would be measured in each category on a scale from 0.0 to 1.0. This helped establish a unique set of audio feature data for each track.
Get Top Tracks and Audio Features
The next step involved pulling down the user’s top tracks and all the associated audio features. You can get up to 50 of an authenticated user’s top tracks in each of three time ranges (long term, medium term, and short term) by calling the /me/top/tracks endpoint.
spotify.get('/me/top/tracks', {
  params: {
    limit: 50,
    time_range: 'short_term'
  }
})
Originally, I thought it would be best to obtain and average the audio features of all 150 of these tracks but I quickly realized, that many tracks led to a rather average result. This appeared in our testing when I noticed we all received “Heartbreak on The Dancefloor.” If you look back at the chart above, you’ll notice the measurements of that track are actually quick average (near 0.5.) In order to get a more dynamic snapshot of the user’s current taste, I focused on the top 10 tracks they have been streaming most recently. So, we only needed to get audio features for those 10 tracks by calling the /audio-features endpoint, passing all the track ids at once.
spotify.get('/audio-features', {
  params: {
    ids: ids
  }
})
Why did we get all 150 tracks if we’re only using 10? Well, we also wanted to take artists into account. Times has many great features on it, including Rhye, Lucky Daye, Nile Rodgers, Robyn, and Frances to name a few. We wanted to make sure users were more likely to get tracks which featured artists they already listen to. We can create a unique array of artist uris by mapping the 150 tracks accordingly.
userArtists() {
  return Array.from(
    new Set(
      userTracks.map(track => {
        return track.artists.map(artist => {
          return artist.uri
        }
      }).flat()
    )
  )
}
With all this data handy, we are ready to calculate some distances.
Calculating Audio Feature Distance
For each audio feature we charted above, we wanted to calculate the distance between the average of the recent tracks’ measurements of said feature and provided measurement for each album track. That statement may be confusing but in practice it is quite simple. Take, for example, the audio feature of danceability. First, we pull all the danceability measurements from our 10 recent tracks as a mapped array of measures.
let measures = recentTracks.map(track => {
  return track.audio_features['danceability']
})
Then we get an average of all of these values:
let average = measures.reduce((a, b) => a + b, 0) / measures.lengthFinally, we can calculate the distances between this average and each album track’s danceability value.
let distances = albumTracks.map(track => {
  return Math.abs(track.audio_features['danceability'] - average
})
That leaves us with an array of distances for each track. The smallest value represents the album track which is closest in distance to the average danceability of the user’s recent tracks.
Now, just do this for each audio feature.
Getting The Closest Song
Once you calculate the distances for each of the audio features for each of the album tracks as mentioned above, you can then sum those distances to figure out how far an album track is from the audio features of the user’s recent tracks.
let trackDistances = trackFeatureDistances.map(distances => {
  return distances.reduce((a, b) => a + b), 0)
})
But before we go determining the closest track, let’s adjust the distances based on any artist matches.
albumTracks.forEach((track, i) => {
  track.artists.forEach(artist => {
    if (this.userArtists.includes(artist)) {
      trackDistances[i] -= 1.0
    }
  })
})
Finally, we can determine which song is the closest by finding the track with the shortest distance.
trackDistances.indexOf(Math.min.apply(null, trackDistances)Lyric Card Generation
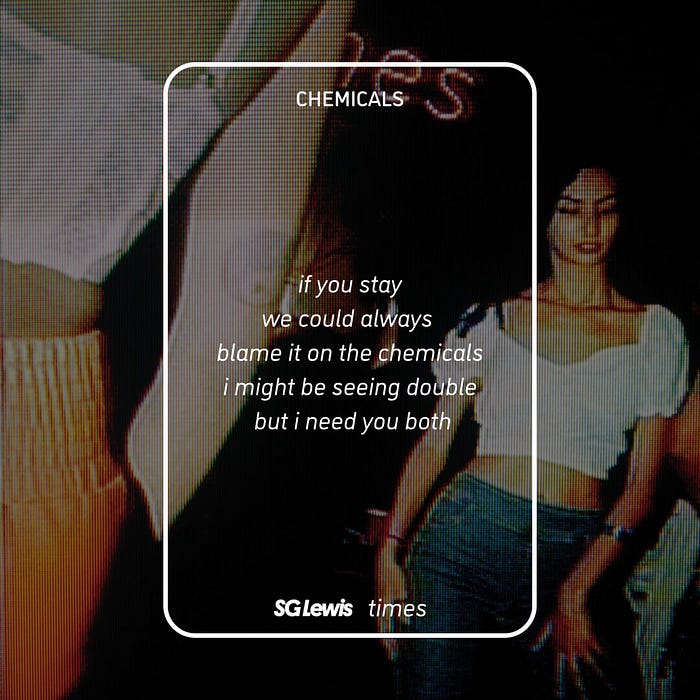
In addition to presenting the user with a video from the artist, revealing their song match, our web app also provides several lyric card images so the user can share their results. If you’re interested in how I approach generating and sharing images on the web, you’re in luck! While developing this project, I wrote a three part series called “The Sharing” which provides an overview and well as guides on generating images using HTML Canvas and ImageMagick on Lambda. I’m hoping to write one more post to round out the series which discusses the sharing UX you see in this very app.
Thanks

Thanks to Monica Seetharam, Adrian Binns, and Grant Motion for allowing me to part of this disco dance party. Shout out to Republic Records and EMI for paying the rent once again. Special thanks to SG Lewis providing the tunes and content which make this activation worth participating in.
Stream times by SG Lewis today and we’ll see you on the dance floor soon.